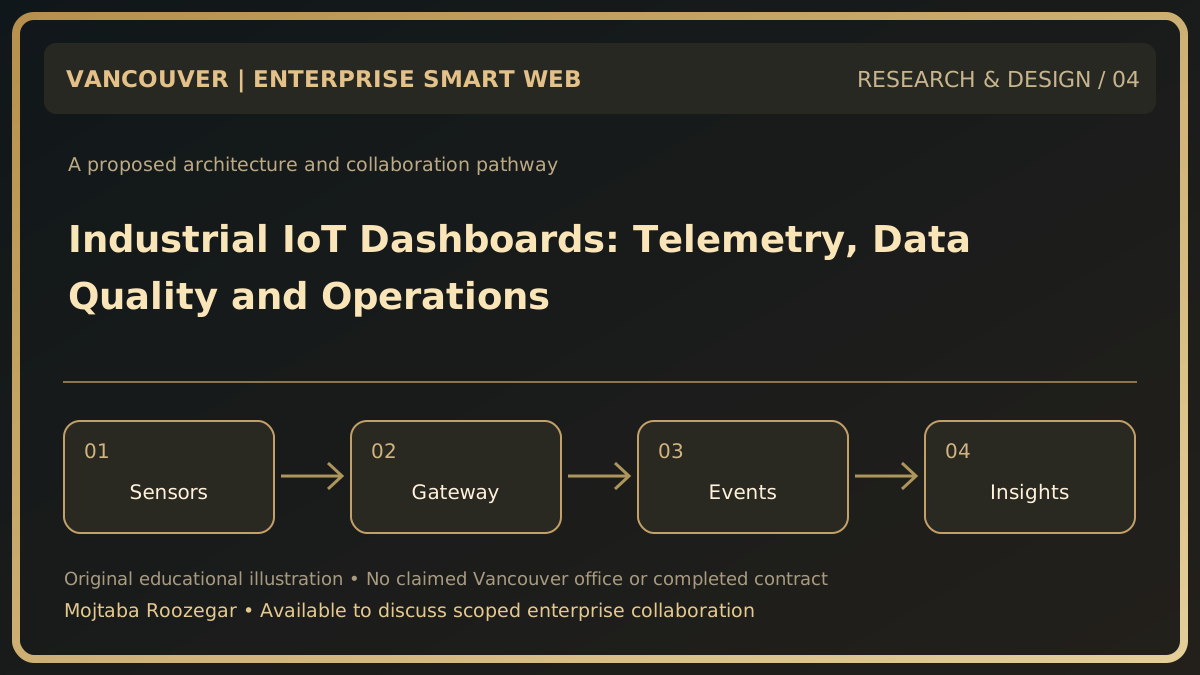
A practical intelligent-web use case
I am interested in working with Vancouver industrial and technology organizations on browser dashboards that help authorized teams understand equipment status. Industrial telemetry differs from ordinary website analytics: incorrect units, missing timestamps or misunderstood equipment states can produce harmful conclusions. A useful interface needs explicit data provenance, latency expectations and a boundary between monitoring and control. This proposal concerns safe information presentation and analytics, not direct remote manipulation of industrial machinery.
Structure telemetry for interpretation
An ingestion design should capture a stable asset identifier, sensor name, unit, event timestamp, gateway receipt timestamp, quality code and source system. Preserve time-zone context and define clock-drift handling. A dashboard showing a temperature value without sensor calibration context can be misleading. Use a well-documented data contract and a schema registry or equivalent change process where warranted. Raw events, derived aggregates and manually entered observations should remain distinguishable.
Secure the boundary with operational technology
Place data collection behind the enterprise's approved gateways rather than exposing programmable logic controllers to the internet. Follow the industrial owner's segmentation, monitoring and change-control requirements. For a first stage, read-only export from a trusted broker or historian is safer than bidirectional control. Authenticate every service and restrict tenant and site access. Alerts should describe uncertainty and data age instead of claiming a machine is healthy merely because its latest reading is green.
Turn readings into responsible decisions
Design views for sensor trends, outage intervals, missing data and maintenance annotations. Summaries might include uptime estimates, but calculations require agreed denominator rules and known gaps. If anomaly detection is introduced, evaluate false positives, missed events, changing operating conditions and model drift. A model-generated warning should lead to human review under existing safety procedures, not automatically override certified systems. Clear explanations and feedback loops are more valuable than an opaque AI label.
Suggested pilot with a Vancouver partner
A useful demonstration could consume a synthetic stream for three virtual assets, show freshness indicators and access rules, and deliberately simulate a disconnected gateway. The acceptance evidence would include replayable events, correct units and documented failure behavior.
Collaboration note: Mojtaba Roozegar is open to discussing a scoped Vancouver enterprise project. This educational proposal does not represent a confirmed Canadian office, commercial client, legal work authorization or deployed solution.